


 15 / 36

C
M
Y
CM
MY
CY
CMY
K
15
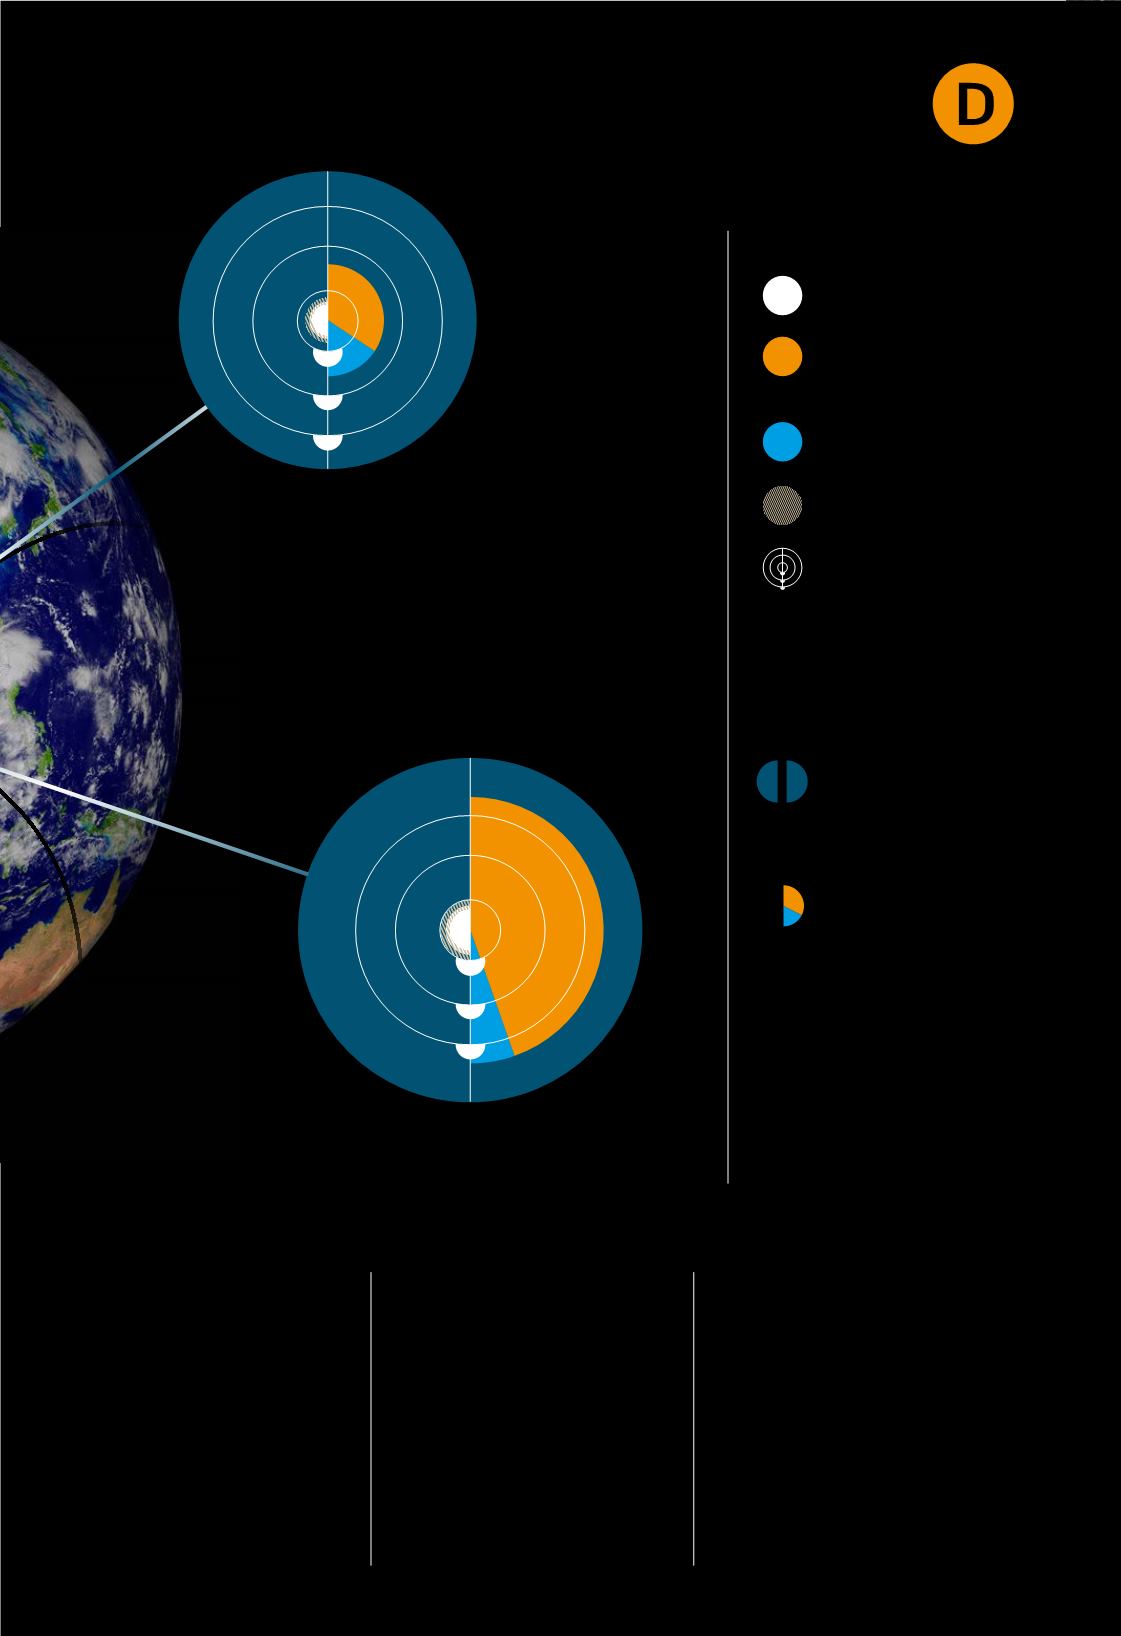
Catchment
YANGTZE
625%
263%
2080
2015
2080
2015
Catchment
MEKONG
is much slower. Here, climate
change is the main motivation for
government authorities to make
improvements.
Rivers only
This is the first time all these
data have been brought together
in a single model. The backbone
of these results is the Global
Flood Risk with IMAGE Scenarios
(GLOFRIS) model. This soware
was developed by, among others,
Hessel Winsemius and it is used
throughout the world. The study
was conducted in collaboration
with the VU University Amsterdam,
Utrecht University, the University
of Twente and the Netherlands
Environmental Assessment
Agency.
Hessel Winsemius was involved in
the past with the development of
the Global Flood Aqueduct Analyzer,
which also helps countries to
establish a picture of increasing
flood risks and to make investment
decisions. At this time, this
information covers rivers only.
The next step will be a world map
that shows the risks associated
with sea-level rise in the same way.
Formore information:
hessel.winsemius@deltares.nl2.5
1.5
0.5
2.5
1.5
0.5
INFOGRAPHIC: JAN PETER HEMMINGA, BASED ON RESEARCH BY HESSEL WINSEMIUS, PUBLISHED IN NATURE CLIMATE CHANGE, DECEMBER 2015.
2015
2080 socio-
economic
change
2080 climate
change
margin of uncertainty
in current prognoses
---%
LEGEND
Sphere size
The size of the spheres
shows the expected damage
by comparison with the
gross national product of
the countries in the river
catchment. The larger the
sphere, the higher the level
of relative damage
Le and right halves
The le half shows the
situation in 2015, the right
half the calculated damage
in 2080.
Orange and blue wedges
The orange wedge shows
how much damage is the
result of economic growth
and the blue wedge shows
the role of climate change.
The number underneath
The percentage below the
sphere shows the extent to
which damage will increase
by comparison with the
current situation.