


 14 / 36

DELTARES, FEBRUARY 2016
14
14
16%
2080
2015
2080
2015
286%
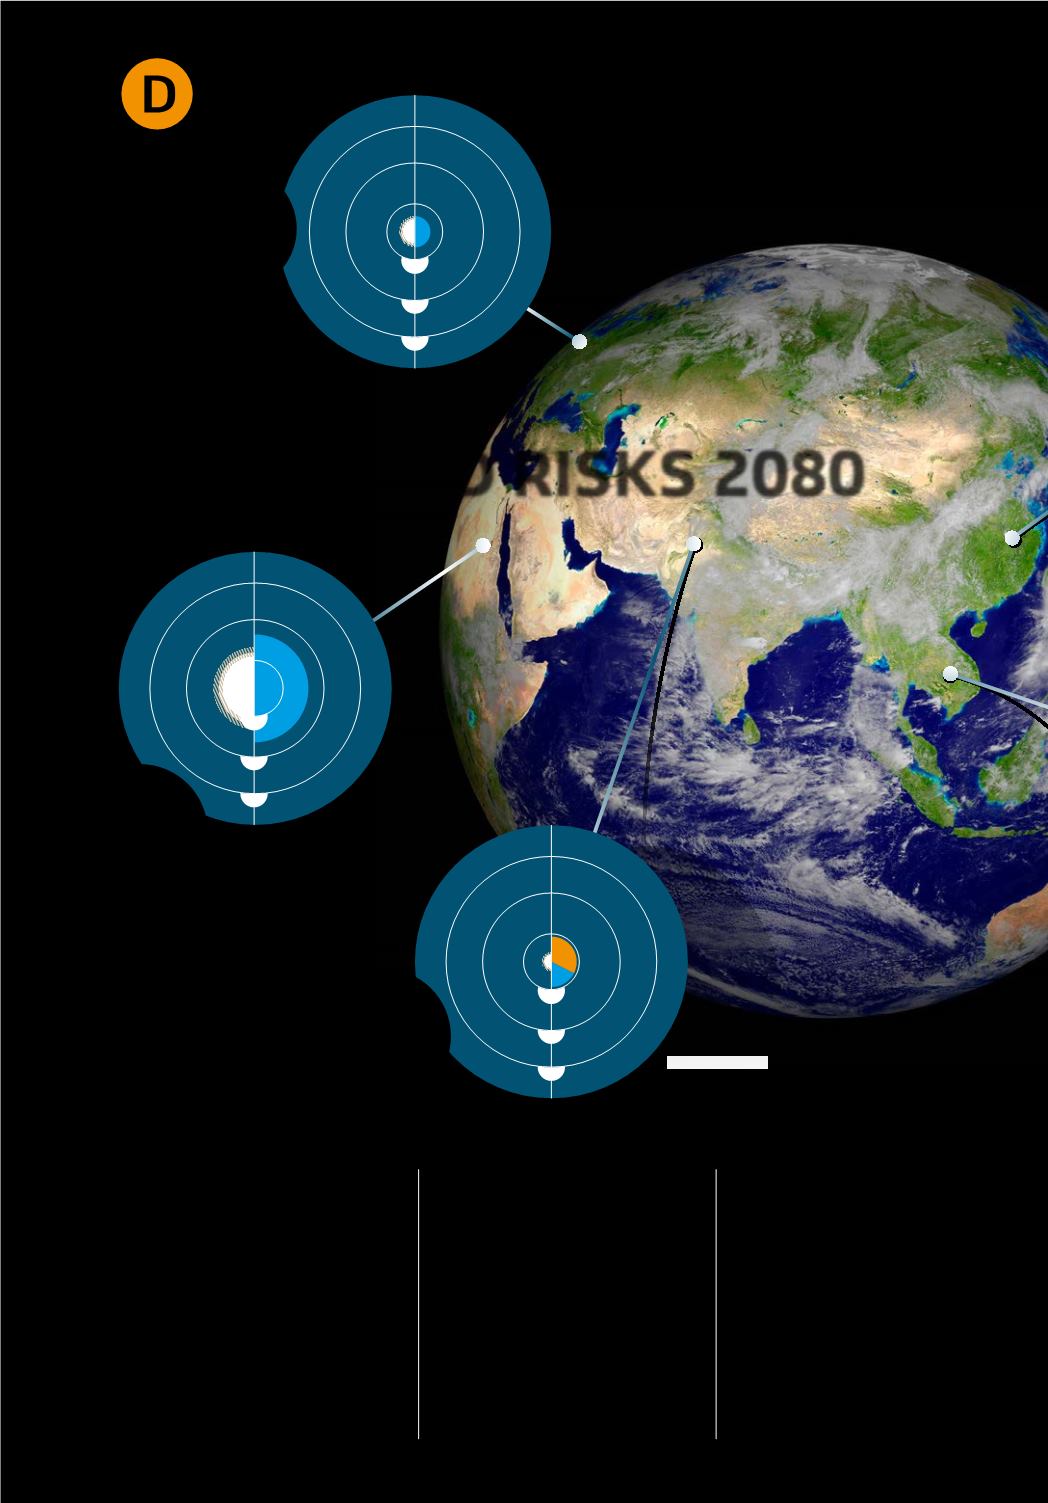
FLOOD RISKS 2080
DOSSIER
FLOOD RISKS
62%
Catchment
NILE
To decide on the best strategy to
combat climate change, we need
accurate figures. That hasn't been
easy until now because most
studies focus only on flood risks,
and not on the question of where
floods have the most impact, which
requires information about local
socio-economic development. A
major study led by hydrologist
Hessel Winsemius that appeared
late last year in Nature Climate
Change includes all these catch-
ment data in a single map.
At risk
But what do the maps show
exactly? That is best explained by
looking at the dierences between,
say, the Mekong and the Rhine. It is
clear that socio-economic growth
has most impact near the Mekong.
Because the population and the
economy are growing fastest here,
the risks associated with flooding
are on the increase.
The good news is that economic
growth also produces the
resources that make it possible
to tackle the impact of floods.
For example by looking closely at
where people settle and at where
action is needed. In Europe, a lot
has already been done around the
Rhine and socio-economic growth
2080
2015
Catchment
RHINE
2.5
1.5
0.5
Catchment
INDUS
2080
2015
2.5
1.5
0.5
2.5
1.5
0.5
OPPORTUNITIES AND RISKS ON THE MAP